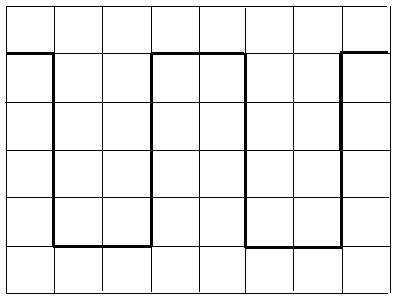
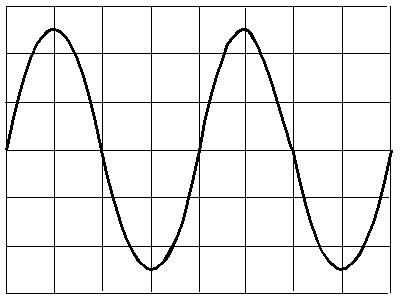
volt/div = 0.5V, time/div = 2 ms.

Name:_______________________________Date:_______________Time:____________
Partner(s):_________________________________________Course:_________________
__________________________________________________________________________
Oscilloscope
A. Visit this signals website and answer the following questions:
1. Sketch V versus t graph of a DC signal, sine wave AC signal, and square wave AC signal below, inside the box.
| DC signal | AC signal, sine wave | AC signal, square wave |
| -------------------------------->t | ------------------------------->t |
-------------------------------->t
|
2. Look at the four AC signals and find out a distinguishing feature of alternating waves.
_____________________________________________________________________
3. Sketch a V versus t graph of a sine wave AC signal and show the following
in the wave:
peak amplitude, peak-to-peak amplitude, and period.
| ----------------------------------------------------------------------->t |
4. Define period and frequency of a wave:
Period: _______________________________________________________________________
Frequency:_____________________________________________________________________
5. Write down the following equations:
a. Frequency in terms of period. _______________
b. rms amplitude in terms of peak amplitude._______________
6. Define rms amplitude:________________________________________________________
B. Visit this oscilloscope website and answer the following questions:
1. What is the function of an oscilloscope?
_____________________________________________________________________________
2. Look at the green screen of the oscilloscope and find the
number of
a. vertical divisions ____________ b.
horizontal divisions____________
3. When a signal is displayed on the screen, what is graphed on the
a. vertical axis
___________
b horizontal axis______________
4. Look at the VOLTS/DIV and TIME/DIV knobs and find out the following:
a. VOLTS/DIV: max ______
min________ b. TIME/DIV: max _______
min________
End of Web site activities------------------------------------------------------------------------------
C. Basics of ac signal:
1. An ac signal can be described with three properties; waveform, amplitude, and frequency. Instead of amplitude, peak-to-peak value or rms(root-mean-square) value can also be used. Meters read rms values. Can you describe the ac signal coming out of a wall-outlet in your home or in the laboratory? Describe three properties below:
1. ___________________ 2. ____________________ 3. ______________________
2.
For the waves shown below, determine peak-to-peak value, amplitude,
period, and frequency.
Peak-to-peak value: Measure
the vertical divisions from trough to crest and multiply it by the VOLTS/DIV
setting. Peak value is half the peak-to-peak value.
Period: Measure the horizontal divisions from one crest (or
trough) to the next and multiply it by the TIME/DIV setting.
The
signal below is observed in a scope display with the following settings:
volt/div = 0.5V, time/div = 2 ms.

| Sq. Wave | Sine Wave | |
| 1. The peak-to-peak amplitude of the signal | ||
| 2. The peak amplitude of the signal | ||
| 3. The period of the signal in second | ||
| 4. The frequency of the signal in Hz |
The
signal below is observed in a scope display with the following settings:
volt/div = 2V, time/div = 1 µs.

D.
Purpose:
To become familiar with the operation of an oscilloscope and to use it to
investigate ac signals.
Apparatus:
Oscilloscope, probe, function generator, and an ac-adapter.
Theory:
f = 1/T; peak amplitude
= (peak-to-peak amplitude)/2, and rms amplitude = (peak amplitude)/1.414.
Calibration check of the oscilloscope:
1. In the oscilloscope, set the input to GND (ground) and connect the scope-probe to the calibration signal of the scope.
2.
Turn on the scope, and you should see a horizontal trace, if
you cannot see the horizontal trace call the instructor.
3. Adjust the position controls and center the trace.
4. Move the input from GND to AC, now you should see a square wave signal.
5. Measure the peak-to-peak value and the period of the signal and complete the data table.
AC-adapter:
1. Write down the listed output voltage properties on the ac-adapter.
2. Connect the ac-adapter wires, white to red and black to black, to the oscilloscope probe and plug in the adapter. Measure the peak-to-peak value and the period of the signal and complete the data table.
Function Generator:
1. Connect the function generator wires to the scope-probe wires. (Red to Red and Black to Black).
2. Set the frequency to 1000 Hz and select sine wave.
3. Measure the peak-to-peak value, determine the amplitude, and complete the data table D3.
4.
Set the amplitude to max, measure the period, and complete the data table D4.
DATA D1. Calibration check:
| 1. The peak-to-peak amplitude of the signal | |
| 2. The peak amplitude of the signal | |
| 3. The period of the signal in second | |
| 4. The frequency of the signal in Hz |
Are your measured values match
the values listed on the front of the scope?_____________
(If not consult the instructor)
D2. Signal from the ac-adapter:
Listed values: Output voltage = ____________ Frequency = ____________
| 1. The peak-to-peak value of the signal | |
| 2. The amplitude of the signal | |
| 3. The rms value of the signal | |
| 4. The period of the signal in second | |
| 5. The frequency of the signal in Hz |
D3. Function Generator: Change the amplitude for a constant frequency.
Frequency = 1000 Hz, Sine wave.
| Amplitude from front dial of the function generator |
From scope display readings |
|
| peak-to-peak value | amplitude | |
| min | ||
| 1/4 turn | ||
| 1/2 turn | ||
| 3/4 turn | ||
| max | ||
D4. Change the frequency for a constant amplitude. Amplitude = max, Sine wave.
| Frequency from the function generator display (Hz) |
From Scope Display Readings |
||
| Period | Period (sec) | Frequency (Hz) | |
| 100 | |||
| 1000 | |||
| 10,000 | |||
| 100,000 | |||
| 500,000 | |||
| 1000,000 | |||
E. Purpose: To measure the inductance (L) of a coil using the resonance of R-L-C circuit.
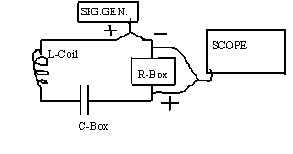
Apparatus: Oscilloscope, probe, function generator, inductor coil, resistance box, capacitance box, and connecting wires.
Background: Visit this RLC resonance applet and answer the following questions:
1. What is R?_______________What is C?______________What is L?_______________
2. In this RLC resonance circuit R, L, C, and the signal source are connected in___________.
3. Reactance of L is Xl and reactance of C is Xc. Change the frequency, f and describe what happens to Xl and Xc as the frequency is changed.__________________________________________
__________________________________________________________________________
4. Set C = 50 nF and keep L = 80 H. What is the resonance frequency, f0 =_________
5. Change R and describe, what happens to the resonance peak?
_________________________________________________________________________
6. Set C = 50 nF and R = 5 kohm. Change L and describe what happens to the resonance peak?
_________________________________________________________________________
Theory:

For a series R-L-C circuit, the resonance frequency (f) is given by, where L = inductance and C = capacitance; (Unit of inductance is Henry, H)
![]()
![]()
Procedure:
1.
Set up the above circuit with R= 100 ohm, C = 0.1 µF, and Function
Generator in sinewave, 100k, and max AMPL.
2. Vary the frequency until the signal in the scope display is maximum. This will happen at the resonance.
3. Record the resonance frequency (f) from the function generator and calculate L.
4. Complete the data table.
| Capacitance, C (µF) | Resonance frequency from function generator display, f (kHz) | Calculated inductance, L (H) |
| 0.1 | ||
| 0.08 | ||
| 0.06 | ||
| 0.05 | ||
| 0.03 | ||
| 0.01 |
5. Keep C = 0.01 µF. Measure the peak-to-peak voltage across the resistance, Vptp as a function of frequency, for 20 kHz, 40 kHz, 60 kHz, 80 kHz, 100 kHz, 120 kHz, 140 kHz, 160 kHz, 180 kHz, and 200 kHz. Tabulate your data and plot Vptp versus f. Draw a smooth curve through the data points.