One of the most important tools for reconstructing ancient environments is a lithofacies map – a map showing the distribution of rock types (lithofacies) in an area. If the rocks are the same age, this map records the relative positions of various environmental settings at that time in the past. By interpreting the depositional environments for each rock type, we can reconstruct the paleoenvironmental settings for an entire region. Creating a lithofacies map appears to be complex and daunting, but is actually rather straightforward. Please follow along with the step-by-step instructions below and then use the instructions on the lab handout to complete exercise 1.2.
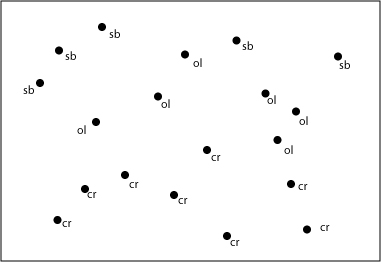
Data: You have been given the following map and table:
Map
Data Table
| Symbol | Lithofacies | Environmental Interpretation |
| sb | shelly, cross-bedded limestone | |
| ol | ooidic limestone with calcareous algae fossils | |
| cr | fossiliferous, porous limestone with large coral fossils |
Step One: Use Table 1.3 in your lab book plus any evidence from fossils to determine the depositional environment for each lithofacies and fill in the data table.
| Symbol | Lithofacies | Environmental Interpretation |
| sb | shelly, cross-bedded limestone | Carbonate beach |
| ol | ooidic limestone with calcareous algae fossils | Shallow subtidal |
| cr | fossiliferous, porous limestone with large coral fossils | Coral reef |
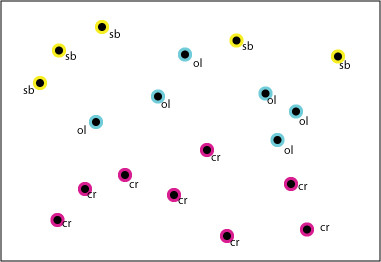
Step Two Choose a color for each lithofacies (try to pick colors that contrast) and add that information to the data table.
| Symbol | Lithofacies | Environmental Interpretation | Color |
| sb | shelly, cross-bedded limestone | Carbonate beach | yellow |
| ol | ooidic limestone with calcareous algae fossils | Shallow subtidal | blue |
| cr | fossiliferous, porous limestone with large coral fossils | Coral reef | red |
Step Three Color the data points on the map with the colors from the table.
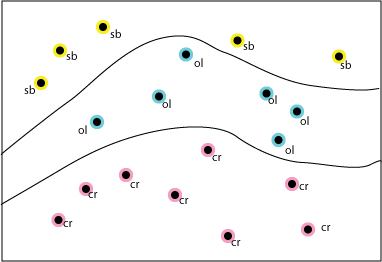
Step FourExamine the map carefully, looking for a pattern in the distribution of colors. Draw lines on the map to differentiate these zones. Do NOT connect the dots – the lines should go between data points with different colors. The map should now be divided into 3 zones. Each zone contains data points of only ONE color.
Step Five Complete the map by coloring in the three zones with the appropriate color and labeling each zone with the correct paleoenvironmental interpretation.
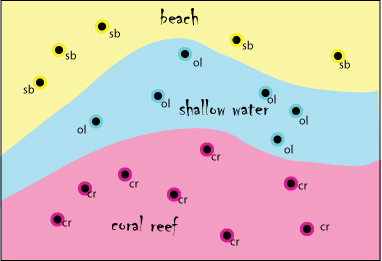
You can now use the map to answer questions about the paleoenvironmental setting in the region. You now have all of the tools you need to do Exercises 1.2 and 1.3. Please complete at least Exercise 1.2 before you come to your class meeting. Please follow the instructions on the lab instruction pdf for Lab Two for these two exercises (trust me, it will streamline the process!).